


One of the biggest risks to investors’ net worth is the portfolio decisions they make.
Failing to adhere to an appropriate long-term strategy has a significant damaging impact on wealth. Since wealth is generated from the compounding of returns, actions that severely reduce an investor’s portfolio balance can have a long-term impact.
A common dangerous action is panicking and pulling out of stocks during a bear market. Such an action limits the immediate damage to a portfolio, but can cause an investor to miss out on the big rebound that follows a large drop by not jumping back into stocks soon enough. Even being out of the market for just one or two years can cause a considerable amount of wealth to be forfeited.
There are alternatives investors can follow that don’t involve correctly forecasting market direction, something most people fail to do on a consistent basis. The first alternative is to simply leave their portfolios unchanged. The second is to periodically rebalance. Rebalancing both lessens the blow of bear markets and gives an investor something to do during a bear market. The latter can play an important psychological role, since having a plan of action may help an investor regain a sense of control.
In this article, I discuss the problem of panic-selling and show how the two alternatives to panicking compare against it terms of portfolio return and volatility. I also show why it makes sense to stick with stocks even if your timing is terrible and you get in near a market top.
Buying High and Selling Low
Reactions to turbulent and bear markets vary by investor. Some are unfazed by large drops in stock prices, and even view them as buying opportunities (“Buffett-like investors”). Others curtail their stock holdings when the market incurs a steep drop, but don’t completely pull out of stocks (“nervous investors”). There also are many who get out of stocks completely during a bear market (“panic investors”) out of fear of incurring further losses.
Given wide variances in how each investor reacts to bear markets—including both the timing and the duration of their major asset allocation decisions—I have yet to see data showing the proportion of investors that fall into each group. The aggregate data does imply, however, that Buffett-like investors are likely a comparatively small group. More people probably fall into the nervous and panic investor groups.
This is not surprising, given the human inclination to be risk-averse. As Daniel Kahneman and Amos Tversky demonstrated with “prospect theory,” we feel the pain of losses much more than we derive pleasure from gains. Compounding matters, we humans commonly engage in hyperbolic discounting, which means we place greater value on rewards received sooner rather than later.
When the market falls and stocks are sold, we see the immediate value of avoiding further losses. What isn’t considered are the potential future gains forfeited by not continuing to stick with stocks or, better yet, by rebalancing and allocating more money into stocks.
The net result of this behavior is a buy high/sell low mentality. When the markets are rising strongly, investors are more likely to put money into stocks (buying high). When a steep market correction or a bear market occurs, investors move to sell their stocks (selling low). Then once the market has rebounded and recorded significant gains, investors notice the profits they are missing out on and they put money back into stocks (buying high). This cycle results in a process of locking in big losses and missing out on big gains.
The buy high/sell low mentality is caused by loss aversion. When stock prices are rising and we don’t have a significant allocation to stocks, we feel the pain of missing out on market gains by not being allocated to stocks. When stock prices are dropping and we see our portfolios falling in value, we feel the pain of the lost financial net worth.
Aggregate data suggests this type of behavior is common. The Investment Company Institute’s ICI tally of net new cash flows into mutual funds is a great example because it encompasses most mutual funds. Investors added $490 billion to equity mutual funds between 1988 and 1995. During the tech bubble years of 1996 through 2000, equity mutual fund flows swelled to a combined $1.1 trillion, more than double the total of the previous eight years combined. Inflows dropped to just $3.3 billion in 2001 and 2002, reflecting $29.6 billion of outflows in 2002. As the market rebounded and rising housing prices made investors feel wealthier, equity fund inflows jumped to $663 billion. Then the financial crisis occurred and investors pulled out a combined $536 billion from equity funds between 2008 and 2012. Inflows did not turn positive until last year, when the S&P 500 index gained 32.4% and investors put $161 billion into equity funds.
Table 1. Performance of the Three Strategies Starting in 1988
| Portfolio Strategy | Rebalance at 5% Thresholds |
No Rebalancing |
Panic and Sell When S&P 500 Falls > 20% |
| Non-Withdrawal Portfolio | |||
| Ending Portfolio Value | $1,087,803 | $1,110,308 | $702,179 |
| Total Return | 987.8% | 1010.3% | 602.2% |
| Standard Deviation | 12.6% | 14.2% | 12.6% |
| Annualized Return | 9.6% | 9.7% | 7.8% |
| Largest Drawdown | -$204,880 | -$253,424 | -$183,385 |
| Largest Annual Loss | -26.9% | -32.8% | -30.0% |
| Ending Equity Allocation | 75.4% | 85.7% | 77.5% |
| Ending Fixed-Income Allocation | 24.6% | 14.3% | 22.5% |
| Withdrawal Portfolio | |||
| Ending Portfolio Value | $551,201 | $595,290 | $350,239 |
| Total Return | 451.20% | 486.4% | 250.2% |
| Standard Deviation | 12.3% | 14.0% | 12.3% |
| Annualized Return | 6.80% | 7.0% | 4.9% |
| Largest Drawdown | -$124,995 | -$155,228 | -$116,982 |
| Largest Annual Loss | -28.1% | -34.0% | -31.4% |
| Total Withdrawals | $167,720 | $167,720 | $167,720 |
| Ending Equity Allocation | 75.0% | 86.5% | 76.7% |
| Ending Fixed-Income Allocation | 25.0% | 13.5% | 23.3% |
Russell Investments looked at the ICI data and concluded that the “average equity investor underperformed the Russell 3000 index by 2.2% annually” during the 29-year period of 1984 to 2013. The firm’s study was based on comparing inflows and outflows from equity funds to simply investing in their broad-based index.
It’s not just the ICI’s data that suggest investors harm themselves. Research firm DALBAR reported that in the 20 years it has been publishing its Quantitative Analysis of Investor Behavior QAIB report, the average investor has trailed the S&P 500 index by more than four percentage points on an annualized basis (5.02% versus 9.22%). In a press release about its 2014 QAIB report, the firm blamed “withdrawing from investments at low points and buying at market highs” for the shortfall.
Morningstar’s investor-return statistics, which Christine Benz shared with me, also paint a picture of underperformance by investors. During the 10-year period ended September 30, 2013, the average investor underperformance gap was 1.47% for all funds (including stock, fixed-income, balanced, alternative and commodity). Investors underperformed domestic stock funds by an average of 1.27%, underperformed international equity funds by an average of 2.25% and underperformed taxable bond funds by an average of 1.52%.
Rebalancing: A Better Method
If panicking is a big problem, a strategy that helps an investor to maintain a constant exposure to stocks should logically produce benefits. While some may view the best advice as simply being “don’t panic and stay allocated to stocks,” such guidance only works well for Buffett-like investors. All other investors need a strategy that gives them a sense of control. This is where rebalancing comes into play.
Rebalancing is the process of adjusting your portfolio back to your targeted allocation. For example, say your allocation calls for a 70% allocation to stocks and a 30% allocation to bonds. After a bad year for equities, your portfolio’s allocation changes to 60% stocks and 40% bonds. Rebalancing would prompt you to shift 10% of portfolio dollars out your bond holdings and into stocks, bringing your portfolio back in line with your targets.
Rebalancing is a buy low/sell high strategy—the opposite of what many investors actually do. It prompts you to buy assets after they have fallen in price. This may sound counterintuitive and may even be difficult to do the first time you try to employ it. Yet its bear market benefits may convince you of its value. Rebalancing lessens the blow of bear markets, making it easier to stick with stocks. In addition, rebalancing restores a sense of control. Rather than being left wondering what the best decision is for your portfolio based on what the pundits are saying about market direction, you have a strategy that prompts you to act and gives direction on how to do it.
Comparing Rebalancing to Panicking
To demonstrate how rebalancing could have provided a benefit to nervous and panic investors, I used hypothetical portfolios based on AAII’s moderate asset allocation model. This model is one of three we track on our website at www.aaii.com/asset-allocation. The moderate asset allocation model uses a 70% allocation to domestic and international stocks and a 30% allocation to bonds. I ran the numbers assuming no withdrawals were made (Non-Withdrawal Portfolio) and assuming retirement withdrawals were made (Withdrawal Portfolio).
Portfolios were rebalanced at the end of each calendar year whenever any specific fund’s weighting was more than five percentage points away from its target allocation (the “rebalance strategy”). This is a trigger point suggested by Vanguard’s Francis Kinniry Jr., Colleen Jaconetti and Yan Zilbering in “Best Practices for Portfolio Rebalancing” (AAII Journal, May 2011). They concluded this threshold is likely to strike a reasonable balance between controlling risk and minimizing costs.
The portfolios use Vanguard mutual funds. I specifically chose Vanguard funds to limit the impact of active management, keep expenses to a minimum and to show as close to real-world results as possible. A starting date of 1988 was used simply because it was the first year with full calendar-year results for some of the funds I wanted to include.
A starting balance of $100,000 was chosen because it can easily be scaled up or down for comparisons. The Withdrawal Portfolio assumes 4% of the first year’s ending balance is withdrawn for retirement expenses. This initial amount is then increased annually to reflect the rate of inflation over the previous 12 months, as measured by the Consumer Price Index (CPI). More details about the construction of the hypothetical portfolios can be found in an appendix below.
To simulate panicking, I assumed an investor pulled completely out of stocks whenever the S&P 500 fell by 20% or more during a calendar year. I further assumed the investor stayed out of the market for 12 months before returning back to his targeted allocation (the panic strategy). I view these assumptions as a good compromise since some investors reduce, but do not completely eliminate their stock holdings, while others not only completely pull out of stocks, but stay out for several years following a bear market. While the specifics of how to best simulate the practice of buying high and selling low are admittedly a subject for debate, one thing is certain: Panicking at the end of 2002 or 2008—which many did—would have caused an investor to miss out on the strong gains that occurred in 2003 and 2009. The impact of missing these two big rebounds is precisely what I simulated.
To give a more a complete comparison, I also looked at what happened if an investor set his portfolio allocation in 1988 and never altered it again (the “no-rebalancing strategy”).
The Negative Wealth Impact of Panicking
Table 1 shows a summary of how the hypothetical portfolios performed. I’ll start with a review of the Non-Withdrawal Portfolio.
From the standpoint of absolute wealth, just letting the portfolio ride without ever altering allocations produced the highest absolute returns (an ending balance of $1,110,308). This is not surprising given 2013’s market rally. Rebalancing came in second with an ending balance of $1,087,803. Risk-reduction strategies, such as rebalancing, reduce a portfolio’s relative upside and are a drag on performance during an extended bull market for the portfolio’s largest asset. (I’ll explain why it may make sense to give up some extra return momentarily.) The panic strategy came in a distant third, with an ending balance of $702,179. In other words, by acting to limit short-term loss during a bear market, the investor ended up forfeiting nearly $400,000 in wealth. It’s a massive amount of money to lose by being too focused on the immediate downside volatility caused by broad market movements.
The Withdrawal Portfolio showed a similar pattern. Not rebalancing resulted in more ending net worth than employing rebalancing did ($595,290 versus $551,201). Panicking, however, resulted in an ending balance of $350,239, 36% less wealth than the rebalancing strategy. The total amounts withdrawn never changed under the three strategies because withdrawals were based on the portfolio’s value at the end of the first year and only increased in response to inflation. This said, the far lower ending balance caused by panicking lessens a retiree’s ability to incur a major expense and/or to pass along wealth to his heirs or preferred charity. If a higher withdrawal rate were used, the difference could also put the retiree at greater risk of running out of money.
Though ending wealth matters, so does volatility. A common trait among investors is the desire to maximize returns and limit losses. The financial markets do not work this way, however. Over long periods, additional return must be sacrificed if the goal is to reduce risk. Conversely, additional risk must be accepted if the goal is to maximize return. This leaves investors with a need to find a suitable balance between risk and reward. To this end, rebalancing works very well. During the last 26 years, rebalancing reduced volatility (as measured by the year-to-year fluctuations in annual returns) by 11.4% over the non-rebalancing strategy for the Non-Withdrawal Portfolio and by 12.2% for the Withdrawal Portfolio.
Even more notable, rebalancing caused the portfolios to experience nearly the same level of volatility as panicking. In other words, although the goal of pulling out of the market was to stop the pain of the bear markets, over the past 26 years, an investor would have experienced the same level of volatility by simply sticking with stocks and rebalancing as necessitated. Plus, he would have been rewarded with greater wealth by doing so.
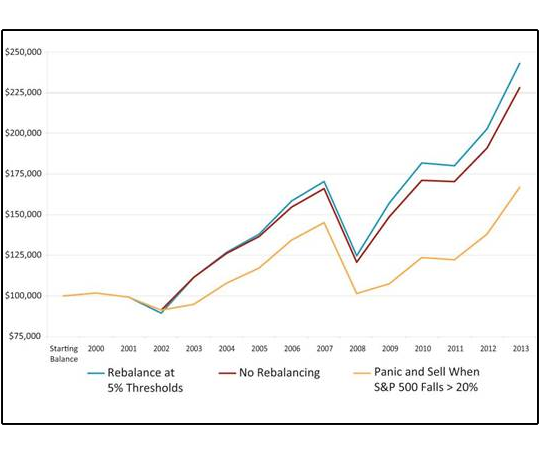
Figure 1. Staying Invested vs. Panicking
I used first standard deviation to calculate volatility, but also calculated drawdown. Standard deviation considers the extent returns varied, either to the upside or the downside, from their average over the period measured. An alternative that is easier for some investors to grasp is drawdown. Drawdown shows the amount of wealth lost. It often used to measure a strategy’s worst year or period of time.
On an absolute dollar basis, it looks like the panic strategy appears to have incurred the smallest drawdown in the Non-Withdrawal Portfolio with a loss of $183,385 in 2008. This number does not tell the full story, however, because the panic strategy started 2008 with a smaller balance than either the rebalancing or the non-rebalancing strategy ($610,571 versus $762,924 and $772,842, respectively). Looking at drawdown from a percentage basis sheds more insight. The panic strategy lost 30% in 2008 versus 26.9% for the rebalancing strategy. The non-rebalancing strategy had the largest drawdown at 32.8%.
Never adjusting a portfolio causes its allocations to drift toward the best-performing assets. This both increases returns over a long period of time and leads to more volatility. The non-rebalanced strategy entered 2008 with an 84.2% weighting to equities. In contrast, the rebalancing strategy entered 2008 with a 70.2% allocation to equities after allocations were adjusted back to target (rebalanced) at the end of 2006. Though these differences are for the Non-Withdrawal Portfolio, the Withdrawal Portfolio also experienced the smallest percentage drawdown when it was rebalanced.
It took last year’s rally in stock prices to give the non-rebalancing strategy a higher ending wealth than the rebalanced strategy. At the end of 2012, greater ending wealth would have been realized by rebalancing than not rebalancing. This difference, which occurred in both the Non-Withdrawal and the Withdrawal Portfolios, is due to the differences in allocation. Not rebalancing caused both portfolios to start 2013 with an approximate 82% allocation to equities, whereas the rebalancing strategy’s equity allocation was slightly below 70% for both portfolios. A greater allocation to stocks boosts returns during bull markets and hurts returns during bear markets relative to a smaller allocation.
(A point of interest: The Non-Withdrawal Portfolio ended 2013 with a 75.4% allocation to equities and a 24.6% allocation to bonds when the rebalancing strategy was used. An investor following this strategy would have been prompted to rebalance his portfolio by shifting money out of the stock fund and into the bond fund at the end of 2013. The Withdrawal Portfolio ended 2013 right on the edge of needing to be rebalanced with a 75% equity/25% bond split.)
What If Your Timing Is Bad?
One concern that keeps investors out of the market is a fear of investing at the wrong time. There is a psychological hurdle to investing when one is concerned the market could fall. Even Buffett-like investors don’t enjoy seeing a stock they recently purchased decrease in value. The problem with waiting on the ideal time to get into the market is that an investor may wait too long to do it. In other words, stock prices may make a significant upward move before the investor reacts and allocates to stocks.
The alternative is for the investor to cross his fingers and allocate in a manner appropriate with his long-term goals regardless of what the market is doing. Doing so, however, can put the investor at risk of lousy market timing—he gets in shortly before a market top is formed and stocks drop considerably in price.
To test the impact of bad timing, I ran two additional scenarios. The first assumed an investor put money into the market at the start of 2000 (near the top of the tech bubble). Figure 1 illustrates the change in portfolio value from 2000 to 2013 for the three versions of this portfolio. The second scenario assumed an investor put money into the market at the start of 2007 (near the top of the housing bubble). In both instances, I looked to see what happened if an investor didn’t do anything, rebalanced or panicked and got out of stocks. Table 2 gives a summary of the results for the 2000–2013 scenario, and Table 3 shows results for the 2007–2013 scenario.
Table 2. Performance Starting in 2000
| Portfolio Strategy | Rebalance at 5% Thresholds |
No Rebalancing |
Panic and Sell When S&P 500 Falls > 20% |
| Non-Withdrawal Portfolio 2000–2013 | |||
| Ending Portfolio Value | $242,973 | $228,090 | $166,806 |
| Total Return | 143.0% | 128.1% | 66.8% |
| Standard Deviation | 14.3% | 13.6% | 12.7% |
| Annualized Return | 6.5% | 6.1% | 3.7% |
| Largest Drawdown | -$45,762 | -$45,341 | -$43,564 |
| Largest Annual Loss | -26.9% | -27.3% | -30.0% |
| Ending Equity Allocation | 75.4% | 72.4% | 77.5% |
| Ending Fixed-Income Allocation | 24.6% | 27.6% | 22.5% |
|
Withdrawal Portfolio 2000–2013 |
|||
| Ending Portfolio Value | $130,795 | $129,385 | $71,464 |
| Total Return | 30.8% | 29.4% | -28.5% |
| Standard Deviation | 14.0% | 12.8% | 11.8% |
| Annualized Return | 1.9% | 1.0% | -2.4% |
| Largest Drawdown | -$37,558 | -$38,120 | -$34,261 |
| Largest Annual Loss | -30.7% | -29.0% | -34.7% |
| Total Withdrawals | $66,775 | $66,775 | $66,775 |
| Ending Equity Allocation | 74.2% | 65.0% | 75.2% |
| Ending Fixed-Income Allocation | 25.8% | 35.0% | 24.8% |
Even with bad timing, it is better to stay invested in stocks. An investor who started the 70% stock/30% bond portfolio in 2000 and never took retirement withdrawals but panicked at the end of 2002 and 2008 would have ended 2013 with approximately $76,000 (31%) less in wealth than an investor who rebalanced instead. The portfolio values at the end of 2013, assuming no withdrawals were made, were $242,973 for the rebalancing strategy and $166,806 for the panic strategy.
The differences are less dramatic for an investor who entered the market at the start of 2007, but they are still significant. The investor who stuck with his original allocation decision and periodically rebalanced would have approximately $24,000 (19%) more wealth than the investor who panicked. If retirement withdrawals were made, the difference in ending wealth between panicking and rebalancing was $59,000 for the portfolio with a 2000 start date.
When a 2007 start date was used, the rebalancing strategy ended with $22,000 more wealth than the panic strategy. More importantly, the panic strategy ended 2013 with a value below its $100,000 initial investment regardless of whether a 2000 or a 2007 start date was used.
Panicking did result in the lowest level of volatility under the 2000 and the 2007 start date scenarios. The lower level of standard deviation was accomplished by avoiding equities during the years with their largest upside moves. Since volatility only measures the magnitude of fluctuation but not the direction of the fluctuations, it can be lowered by avoiding good years, bad years, or both. Equity allocations also explain why the non-rebalancing strategy incurred less volatility and had a lower ending balance than the rebalancing strategy in the 2000 and the 2007 start date scenarios.
In the 2000 scenario, the rebalancing strategy ended with a 75.4% allocation to equities versus a 72.4% allocation for the non-rebalancing strategy when no withdrawals were made. In the 2007 scenario, the ending equity allocations were 75.4% and 71.4%, respectively, when no withdrawals were made. This should not be surprising, since rebalancing purposely shifted the allocations back to target while not rebalancing allowed the market to determine how the portfolio’s allocation evolved.
The percentage drawdowns were the largest in the panic strategy for the Non-Withdrawal Portfolio and the Withdrawal Portfolio in the 2000 start date scenarios. The panic strategy entered 2008 with the largest allocation to equities for both portfolios because it assumed an investor reverted back to his targeted allocations at the start of 2004 after being out of stocks for one year.
The rebalancing strategy’s allocations were adjusted back to target in 2001 and 2006 for the Non-Withdrawal Portfolio and in 2001, 2002 and 2004 for the Withdrawal Portfolio. Equity allocations under the non-rebalancing strategy were lowered in 2001 and 2002 by the bursting of the tech bubble.
Table 3. Performance Starting in 2007
| Portfolio Strategy | Rebalance at 5% Thresholds |
No Rebalancing |
Panic and Sell When S&P 500 Falls > 20% |
| Non-Withdrawal Portfolio 2007–2013 | |||
| Ending Portfolio Value | $153,389 | $145,418 | $129,343 |
| Total Return | 53.4% | 45.4% | 29.3% |
| Standard Deviation | 17.5% | 16.6% | 15.7% |
| Annualized Return | 6.3% | 5.5% | 3.7% |
| Largest Drawdown | -$28,890 | -$28,890 | -$28,890 |
| Largest Annual Loss | -26.9% | -26.9% | -26.9% |
| Ending Equity Allocation | 75.4% | 71.4% | 77.5% |
| Ending Fixed-Income Allocation | 24.6% | 28.6% | 22.5% |
|
Withdrawal Portfolio 2007–2013 |
|||
| Ending Portfolio Value | $109,152 | $99,578 | $87,175 |
| Total Return | 9.2% | -0.4% | -12.8% |
| Standard Deviation | 16.9% | 15.5% | 14.8% |
| Annualized Return | 1.3% | -0.1% | -1.9% |
| Largest Drawdown | -$31,868 | -$31,868 | -$31,868 |
| Largest Annual Loss | -30.9% | -29.6% | -30.9% |
| Total Withdrawals | $31,596 | $31,596 | $31,596 |
| Ending Equity Allocation | 74.2% | 65.3% | 75.8% |
| Ending Fixed-Income Allocation | 25.8% | 34.7% | 24.2% |
The drawdowns in 2008 are the same for all three strategies in each of the 2007 start date portfolios because the financial crisis started soon after the portfolios were started.
Concluding Remarks
The data clearly shows a penalty for panicking. Even if an investor has terrible timing decisions, he will do okay as long as he sticks to his allocation rather than pulling out after a loss is incurred. Incorporating a rebalancing strategy can help with the psychology. As the numbers show, rebalancing can both reduce volatility and lessen the blow of bear markets.
A compromise solution for those who feel nervous about investing in an asset that may have a large potential downside is to allocate to less-volatile segments of the asset class. For equities, this would be larger-capitalization domestic stocks, and even less economically sensitive sectors such as health care and utilities. For fixed income, this would be higher credit quality and shorter duration (less interest rate sensitivity) bonds. This would preserve the allocations while reducing some of the volatility at the expense of giving up some upside when that asset class finally rebounds in price.
Data for all of the portfolios and models, including year-by-year balances and returns, are available here. The return statistics for each of the funds come from Morningstar.com and track the annual change in net asset value.
Complete Data for All Portfolios and Variations
Download the Excel spreadsheets by clicking on each link:
Portfolios Starting in 1988
Portfolios Starting in 2000
Portfolios Starting in 2007
Appendix
Index mutual funds from Vanguard were used to limit the impact of active management, keep expenses to a minimum and to show close to real-world results. It is very possible for an investor to have mimicked these hypothetical portfolios and achieved similar results. Keep in mind that withdrawals made from a traditional IRA or a similar type of tax-deferred account would be taxed. The results shown in this article are on a pretax basis.
The specific target portfolio allocations are 20% in the Vanguard 500 Index fund (VFINX); 20% in the Vanguard Mid-Cap Index fund (VIMSX); 10% in the Vanguard Small-Cap Index fund (NAESX); 20% in the Vanguard Total International Stock Index fund (VGTSX), which invests in both developed and emerging market countries; and 30% in the Vanguard Total Bond Market Index fund (VBMFX). This allocation is equivalent to our moderate portfolio allocation model, which can be seen at http://www.aaii.com/asset-allocation.
The starting year of 1988 was chosen because that was the first year enough index funds were available to conduct the study. A 20% allocation to Vanguard International Value fund (VTRIX), an actively managed fund, was used through the end of 1996, when Vanguard Total International Stock Index fund (VGTSX) was launched. A 30% allocation to the Vanguard Extended Market Index fund (VEXMX) was used from 1988 until 1998, when Vanguard Mid-Cap Index fund (VIMSX) became available. At the start of 1999, the VEXMX allocation was split between VIMSX (two-thirds) and Vanguard Small-Cap Index fund (NAESX) (one-third) to achieve the desired 20% mid-cap and 10% small-cap allocation.
The seasonally adjusted Consumer Price Index for all urban consumers (CPI-U) was used to adjust the annual withdrawal rates. This data can be downloaded, for free, at http://www.econstats.com/bls/blsnea8.htm.
by Charles Rotblut, CFA AAII.
Charles Rotblut, CFA is a vice president at AAII and editor of the AAII Journal. Follow him on Twitter at twitter.com/charlesrotblut.
IMPORTANT: This website is only intended for clients and interested investors residing in states in which the Adviser is qualified to provide investment advisory services, and is not an invitation to invest. Please contact us to find out if we are qualified to provide investment advisory services in the state where you reside and to learn more about what we do.
THIS INFORMATION IS BELIEVED BY US TO BE ACCURATE BUT MAY CONTAIN ERRORS. IT IS GENERIC AND MAY NOT BE SUITABLE TO YOUR PARTICULAR SITUATION. DO NOT RELY ON IT. NEVER INVEST WITHOUT CAREFULLY REVIEWING OFFERING DOCUMENTS, ON WHICH ALONE YOU SHOULD RELY. ALL INVESTING ENTAILS RISK. CAPITAL NOT GUARANTEED.