
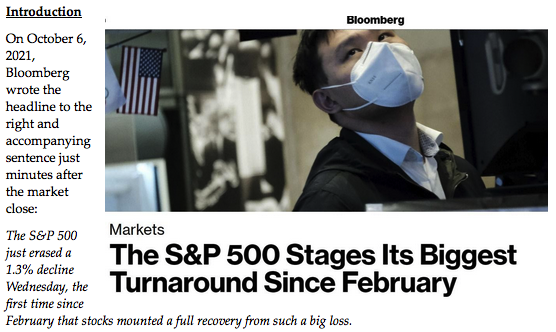
It’s not hard to see why Bloomberg would write such a headline. The S&P 500 Index, or Standard & Poor’s 500 Index as its formally known, is one of the most quoted stock indexes in the world. When readers see such a headline, many will immediately think, “the stock market recovered today!”
Is this really the case that the “true” stock market really recovered because the S&P 500 had a large “turnaround”? We’ll find out soon enough, but let’s first look at a stock market indicator that is well known – in both good and bad ways.
Another Famous Index: The Dow Jones Industrial Average
- Includes only 30 stocks and is hence not truly representative of the economy.
- Uses a price-weighted methodology whereby a company with a stock price twice as high as another company will have twice the impact on the average even if the company’s valuation isn’t twice as high.
- No longer truly represents “Industrial” stocks
The S&P 500 appears to rectify the disadvantages that the DJIA has; the S&P 500 index:
- Includes approximately 500 stocks, or over 16 times the number that the DJIA has.
- Uses a market-capitalization-weighted methodology; every company will affect the change in the S&P 500 index level using its perceived value in the marketplace, not just that of a stock price.
- Is intended to be representative of many sectors, not just those classified as “Industrial.”
Since the S&P 500 index apparently corrects many of the deficiencies of the DJIA, should we consider it to be the “best” or even “good” index to use when evaluating portfolio performance?
The answer is NO. Let’s explore why.
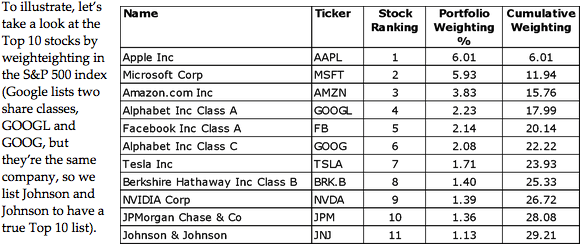
We show the weighting of each company in the index followed by a cumulative weighting. As you can see, just ten (10) of the companies in the index make up almost 30% of the entire S&P 500 index.
We can then extend this to the entire index of 508 stocks. As you can see in the chart below, almost 50% of the index can be attributed to just 40 stocks!

In short, owning the S&P 500 is effectively buying two baskets of equal size: one consisting of just 40 companies and another consisting of 468 companies. The S&P 500 is not really buying 500 (or more precisely 508) companies uniformly!
What the S&P 500 Excludes
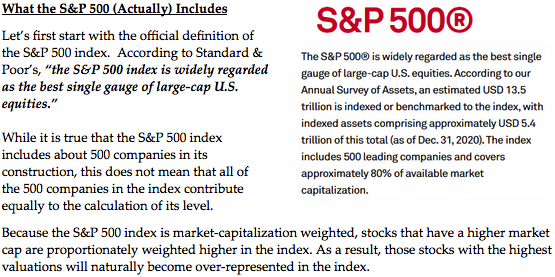
Let’s return to the official definition of the S&P 500 index: “The S&P 500 index is widely regarded as the best single guage of large-cap U.S. equities.”
Let’s unpack two important parts of this sentence.
The first part is that this index covers “Large-Cap” companies. This implies that two other types of companies are not included in the index: Mid-Cap and Small-Cap companies. As stated by Standard & Poor’s, this includes only 80% of available market capitalization, so this leaves about 20% of the U.S. stock market – primarily Mid-Cap and Small-Cap companies – excluded.
Summary
While the S&P 500 index is certainly an improvement over older indexes – particularly the Dow Jones Industrial Average – it still has many deficiencies.
Academic research has shown that diversifying portfolios – across market capitalization, across countries, across industries, etc. – is the best way to invest. Limiting oneself to buying only those well-known U.S. companies that comprise the vast majority of the S&P 500 index – while psychologically appealing – is suboptimal from an investing perspective.
We at RVW Wealth invest our portfolios such that they are diversified globally and across varying sizes (i.e. market capitalizations). As such, evaluating performance by looking at only U.S. Large-Cap stocks is neither the best way to invest, nor the best way to evaluate portfolio performance. For these reasons, the S&P 500 is a bad benchmark to use for well-diversified portfolios.