

Why a Stock Peak Isn’t a Cliff.
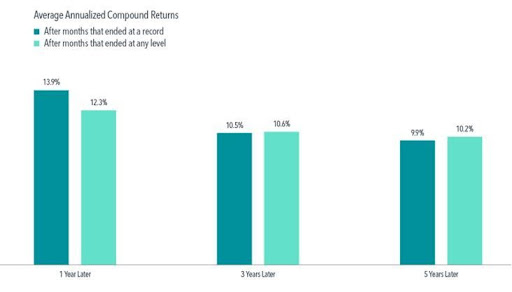
Many investors may think a market high is signal stocks are overvalued or have reached a ceiling. But they may be surprised to find out that the average returns for the S&P 500 Index one, three, and five years after a new market high are similar to the average returns for the index over any one-, three-, or five-year period.
In looking at all 1,000-plus monthly closing levels between 1926 and 2021 for the S&P 500 Index, 30% of the monthly observations were new market highs. After those highs, the average annualized compound returns ranged from nearly 14% one year later to just under 10% five years later. Those results were close to average returns over any given period of the same length. When viewed in terms of the index simply having risen or fallen, the S&P 500 was higher a year after notching a record 82% of the time, and 78% of the time after five years.
History Shows That Stock Gains Can Add Up After Big Declines
Sudden market downturns can be unsettling. But historically, US equity returns following sharp downturns have, on average, been positive.
- A broad market index tracking data since 1926 in the US shows that stocks have tended to deliver positive returns over one-year, three-year, and five-year periods following steep declines.
- Cumulative returns show this to striking effect. Five years after market declines of 10%, 20%, and 30%, the compounded returns all top 50%.
- Viewed in annualized terms across the longest, five-year period, returns after 10%, 20%, and 30% declines have been close to the historical annualized average over the entire period of 9.7%.1 Sticking with your plan helps put you in the best position to capture the recovery.
The Cost of Trying To Time the Market
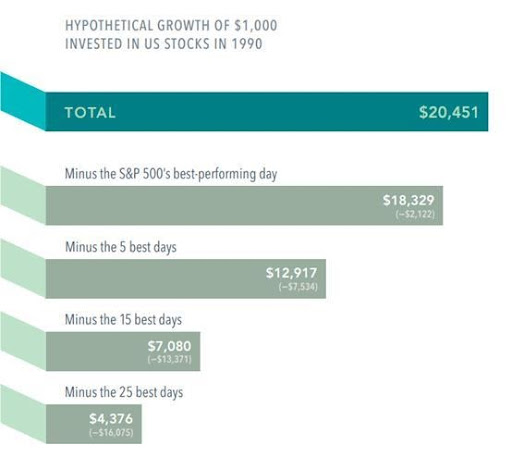
The impact of missing just a few of the market’s best days can be profound, as this look at a hypothetical investment in the stocks that make up the S&P 500 Index shows. Staying invested and focused on the long term helps to ensure that you’re in position to capture what the market has to offer.
- A hypothetical $1,000 turns into $20,451 from 1990 through 2021.
- Miss the S&P 500’s five best days and the return dwindles to $12,917. Miss the 25 best days and that’s $4,376.
- There’s no proven way to time the market—targeting the best days or moving to the sidelines to avoid the worst—so history argues for staying put through good times and bad. Missing only a few days of strong returns can drastically impact overall performance.
Well-designed resilient equity portfolios have delivered stellar returns over time. Not all the time. Knowing the distinction is the hallmark of savvy investors. The key attribute of successful investors is the ability to control instinct and impulse. The key is time in the market – not timing the market.