

The stock market has had a solid year, even after the third quarter declines, which were driven by a continued tight monetary bias from the Federal Reserve. This, in turn, sent bond yields higher, unsettling stock investors throughout August and September. September’s weakness was nothing out of the ordinary, given that the month has historically seen some of the weakest market performances on the calendar. The second-quarter earnings season, which largely ended in August, helped support stocks with better-than-expected results. With 485 of the companies in the S&P 500 reporting, 79 percent posted earnings above market estimates. Perhaps more importantly, Wall Street’s outlook for third-quarter earnings improved during the quarter.
The diversification of RVW equity exposure, the methodologies of stock election we employ, and the addition of investment-grade bonds and select alternative investments where appropriate withstood the volatility as anticipated. Our validated approach to the prudent stewardship of wealth is informed by decades of academic research and our own experience over a quarter of a century.
While the major indexes were higher, the appreciation was driven almost entirely by the “Magnificent 7” (Apple, Microsoft, Nvidia, Amazon, Google, Tesla, and Meta), while the average stock declined in value. Historical data suggests that this sort of trading action occurs in market bubbles and that priced-for-perfection “top dog” stocks with high valuations tend to subsequently underperform. Sky-high valuations leave no margin for error, and small earnings misses could lead to parabolic corrections.
Historically, excessive relative valuations are negatively correlated with long-term success. There are numerous examples, like the “dot-com bubble,” which saw the technology-laden Nasdaq appreciate 5-fold and then collapse from over 5,000 in March 2000 to 1,100 by that October, led by such names as pets.com, Webvan, Worldcom, and eToys. In the late 1980s, the bubble in Japanese stocks burst and took the Nikkei 225 down by almost 40%. Going back to the late 1960s and early 1970s, the so-called “nifty fifty” was a group of seemingly indestructible stocks—including Polaroid, Sears, and Eastman-Kodak—that captured the minds of investors and are now almost all gone or insignificant. During the mid-2000s, excitement over investments in emerging markets was accompanied by pervasive usage of “the BRICs”—Brazil, Russia, India, and China—as a term of art for the fast-growing nations at the heart of the investment frenzy. That overheated sector also suffered severe declines in value subsequently, as did the meme stocks of the RobinHood era of 2021, like Gamestop, AMC, Blackberry, and WeWork.
There continues to be a deluge of unsettling headlines: Interest rates are rising, oil prices are up, the dollar has been strengthening (which is good for inflationary control but bad for corporate earnings), monetary policy is tight, and debt delinquency rates are normalizing. There’s also China’s slowing economy, the restart of student loan payments, ongoing labor strikes, and the ever-present threat of a U.S. government shutdown.
To be clear, it’s not all bad news: Job creation is solid and surpassing expectations. Corporate profits are expected to grow significantly over the next few years, with high profit margins being maintained. The most powerful tailwinds are the efficiencies of Generative Artificial Intelligence (see below) and the onshoring of manufacturing. Consumer spending continues to be healthy, and personal consumption represents 70% of total economic activity. Business investment order activity remains strong, which is bullish as this is both an indicator of future growth and a source of growth. Inflation is declining, which is good news for consumer spending power and indicates that the Federal Reserve’s effort is working. Much of the resilience in the economy can be explained by the fundamental strength of business and consumer finances.

SEPTEMBER’S JOB REPORT WAS STRONG
The U.S. economy added 336,000 jobs in September, stunningly strong gains that roughly doubled economists’ forecasts.

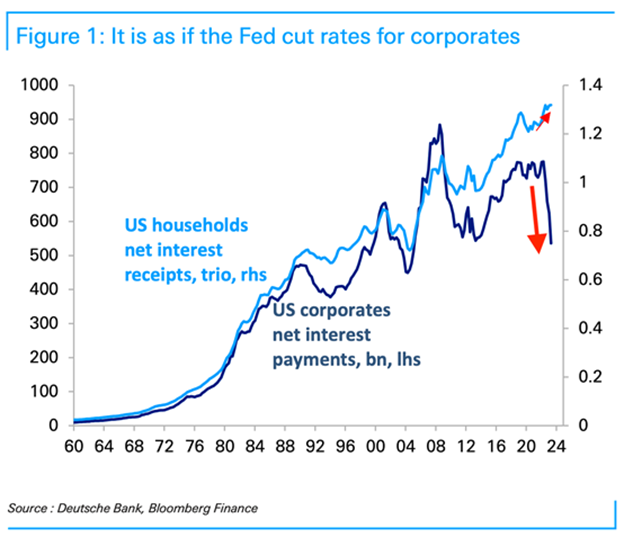
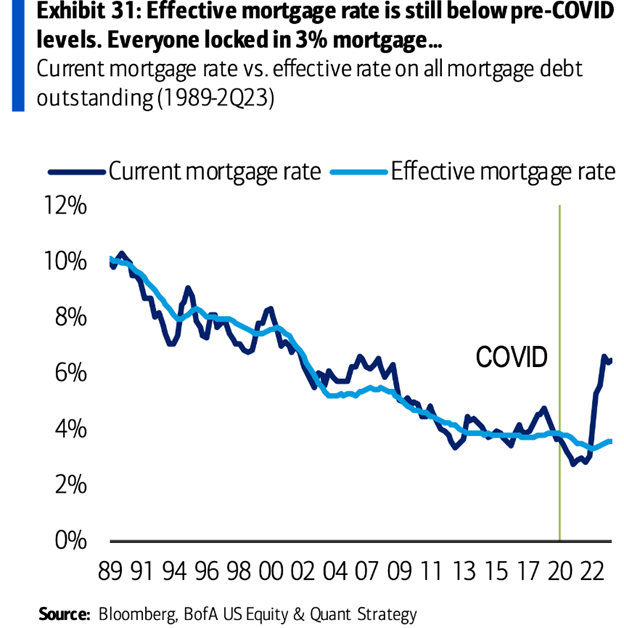
While rising interest rates are usually considered a headwind, there’s some counterintuitive nuance to the narrative. Many companies refinanced much of their debt over the past three years, locking in very low interest rates, so as market interest rates have risen, the effective interest rate corporations are paying today remains low. Similarly, the vast majority of outstanding mortgages have a locked-in rate that’s lower than the current market rate, meaning for many consumers, the financing cost of their largest liability has been unchanged.
We should be prepared for tight financial conditions to linger. Monetary policy will likely be unfriendly to markets, and the risk that the economy slips into a recession will be relatively elevated. At the same time, we know that stocks are discounting mechanisms, meaning that prices will likely have bottomed out before the Fed signals a major dovish turn in monetary policy. When entering the stock market, long-term investors must remember that recessions and bear markets are part of the deal. Volatility is the price paid by savvy equity investors for the extraordinary returns they have earned over time.
CHARTS THAT TELL THE STORY
A picture tells a thousand words, and a chart tells a thousand pictures.
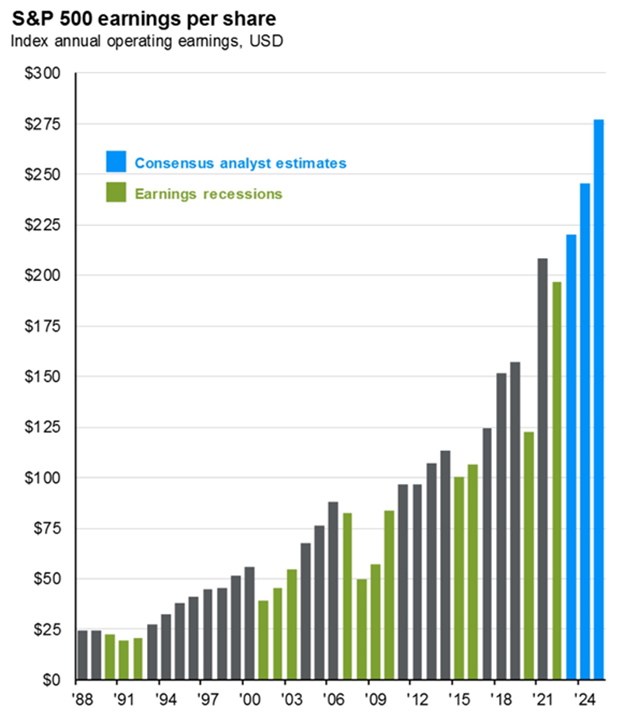
- CORPORATE EARNINGS ARE EXPECTED TO GROW AFTER A BRIEF DECLINE
This is a key engine that drives equity returns and economic prosperity.
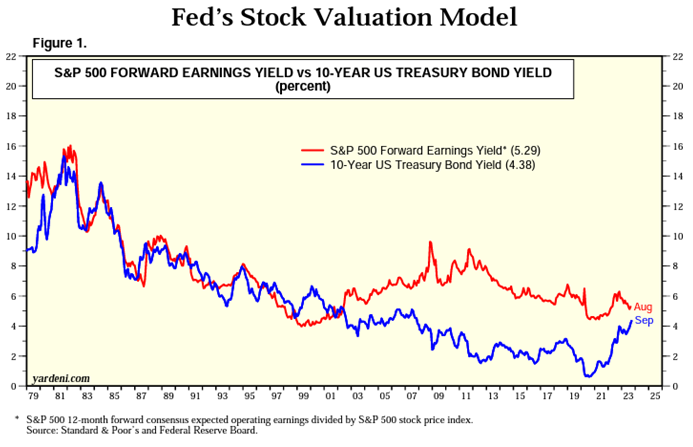
2. BY THIS CLASSIC VALUATION METHOD, STOCKS ARE NOT OVER-VALUED:
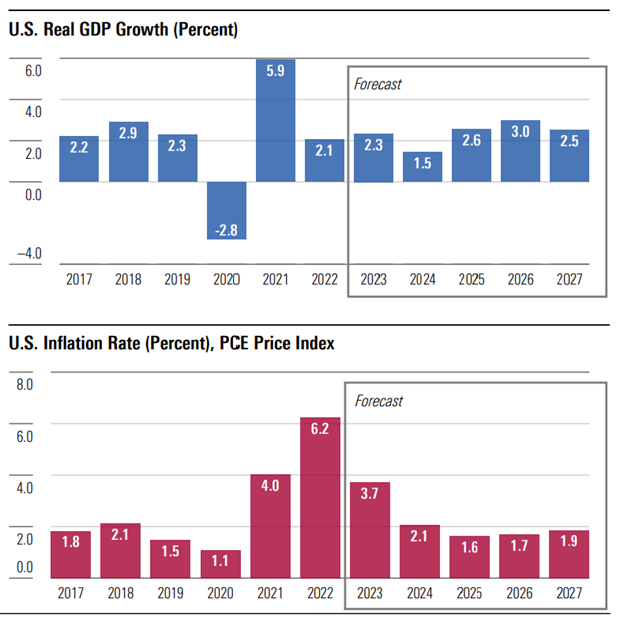
3. THE ECONOMY IS EXPECTED TO GROW AND INFLATION IS DECLINING:
4. EFFECTIVE RATES FOR CORPORATE BORROWERS IS LOW:
5. HOME MORTGAGES WERE LOCKED IN AT LOW RATES:
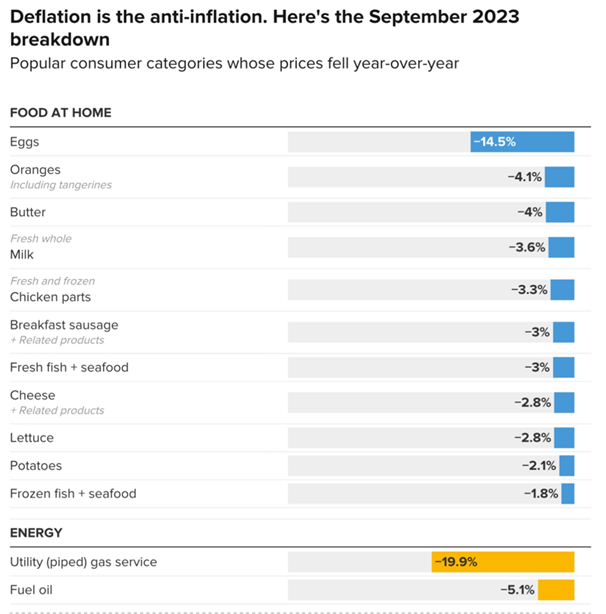
6. INFLATION IS UNDER CONTROL AND DECLINING:
THE U.S. ECONOMY’S SECRET WEAPON:
SENIORS WITH MONEY TO SPEND
Americans 65 or older account for a record share of spending and
are less susceptible to interest rates.
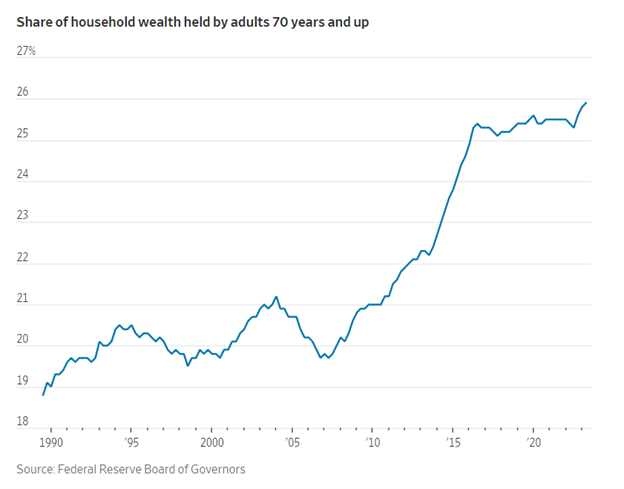
Currently, retirees make up a greater portion of the population than at any other time on record. They’re less reliant on borrowing and less at risk of layoffs than other consumers, making them a spending force to be reckoned with. According to the Census Bureau, 18% of the population is 65 or older, the highest on record going back to 1920 and up sharply from 13% in 2010. Approximately 10,000 Americans turn 65 every day.
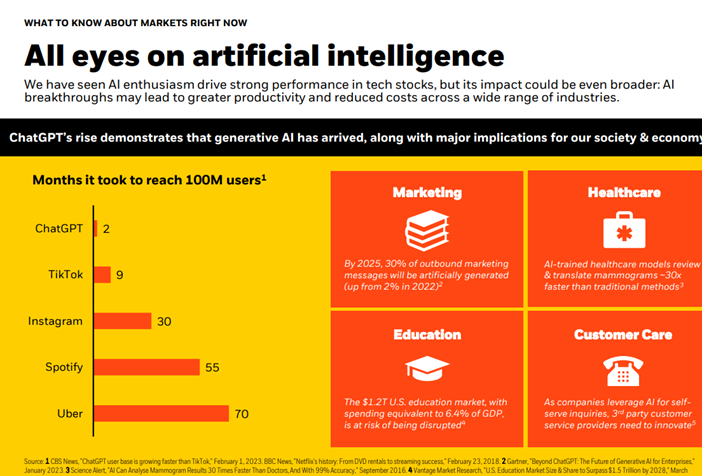
GENERATIVE ARTIFICIAL INTELLIGENCE: LOOKING UNDER THE HOOD
SOURCE: PWC
Artificial intelligence may be one of the biggest technological leaps in history. It is poised to unlock new business models, transform industries, reshape people’s jobs, and boost economic productivity. The economic impact of AI between now and 2030 is projected to be a whopping $15.7 trillion, which is more than the current output of China and India combined. Of this, $6.6 trillion is likely to come from increased productivity, and $9.1 trillion is likely to come from consumption-side effects.
CORE RVW INVESTING PRINCIPLES:
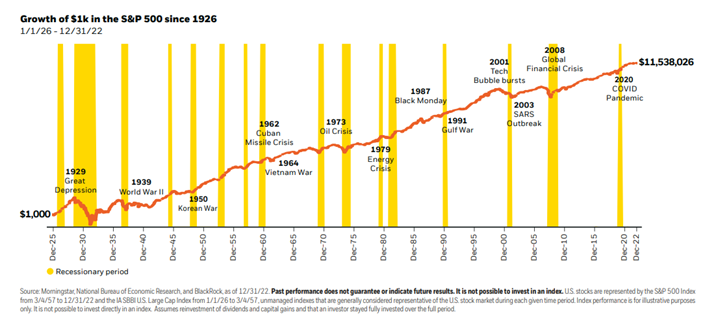
Select Diversified Equities have been a stellar long-term investment. Note the yellow bars signaling recessions, and see why we’re not fearful of the next one.
THE POTENTIAL COST OF TRYING TO TIME THE STOCK MARKET
Timing the market seems simple enough: buy when prices are low and sell when they’re high. But there is clear evidence that market timing is difficult and requires two well-timed decisions:
when to sell and when to repurchase. Selling appreciated securities entails a tax cost. Often, investors will sell early, missing out on a stock market rally. It can also be unnerving to invest when the market is flashing red. By contrast, staying invested through highs and lows has generated competitive returns, especially over longer periods, and allows assets to compound free of a large annual tax bill. Tax-deferred compounding is one of the attractive features of long-term equity investing.
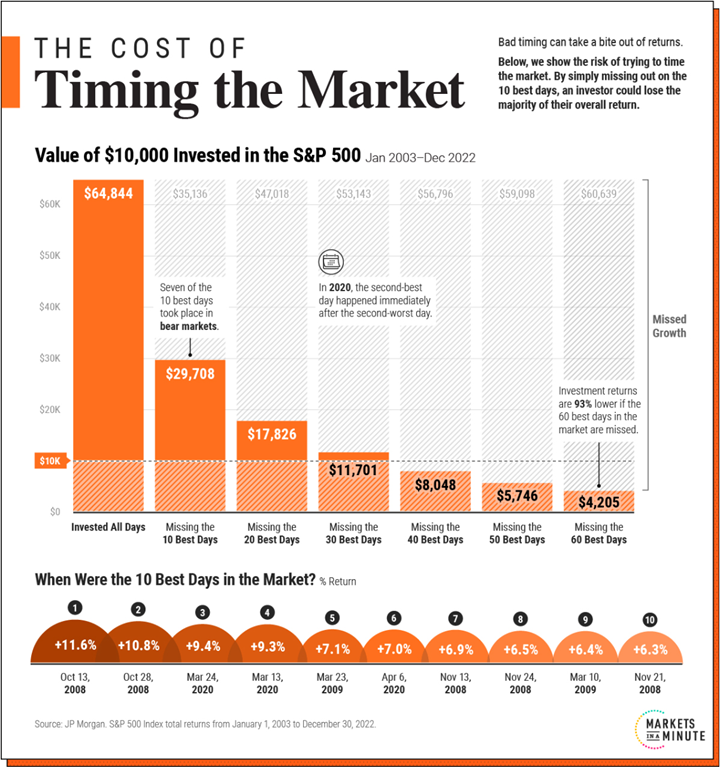
The below graphic shows how trying to time the market can take a bite out of your portfolio value, using 20 years of data from JP Morgan.
THE PITFALLS OF TIMING THE MARKET
Mistiming the market even by just a few days can significantly affect an investor’s returns.
The following scenarios compare the total returns of a $10,000 investment in the S&P 500 between January 1, 2003, and December 30, 2022. Specifically, it highlights the impact of missing the best days in the market compared to sticking to a long-term investment plan.
| $10,000 Invested in the S&P 500 End Portfolio Value |
Annual Return (2003-2022) |
|
| Invested All Days | $64,844 | +9.8% |
| Missed 10 Best Days | $29,708 | +5.6% |
| Missed 20 Best Days | $17,826 | +2.9% |
| Missed 30 Best Days | $11,701 | +0.8% |
| Missed 40 Best Days | $8,048 | -1.1% |
| Missed 50 Best Days | $5,746 | -2.7% |
| Missed 60 Best Days | $4,205 |
-4.2% |
As we can see in the above table, the original investment grew over sixfold if an investor was fully invested for all days.
If an investor were to simply miss the 10 best days in the market, they would have shed over 50% of their end portfolio value. The investor would finish with a portfolio of only $29,708, compared to $64,844 if they had just stayed put.
Making matters worse, by missing 60 of the best days, they would have lost a striking 93% in value compared to what the portfolio would be worth if they had simply stayed invested.
Overall, an investor would have seen almost 10% in average annual returns using a buy-and-hold strategy. Average annual returns entered negative territory once they missed the 40 best days over the time frame.
THE BEST DAYS IN THE MARKET
Why is timing the market so hard? Often, the best days take place during bear markets
|
Date |
Return |
|
|
1 |
Oct 13, 2008 |
+12% |
|
2 |
Oct 28, 2008 |
+11% |
|
3 |
Mar 24, 2020 |
+9% |
|
4 |
Mar 13, 2020 |
+9% |
|
5 |
Mar 23, 2009 |
+7% |
|
6 |
Apr 6, 2020 |
+7% |
|
7 |
Nov 13, 2008 |
+7% |
|
8 |
Nov 24, 2008 |
+7% |
|
9 |
Mar 10, 2009 |
+6% |
|
10 |
Nov 21, 2008 |
+6% |
Over the last 20 years, seven of the 10 best days happened when the market was in bear market territory.
Adding to this, many of the best days take place shortly after the worst days. In 2020, the second-best day fell right after the second-worst day that year.
Similarly, in 2015, the best day of the year occurred two days after its worst day. Interestingly, the worst days in the market typically occur in bull markets.
WHY STAYING INVESTED BENEFITS INVESTORS
As historical data shows, the best days happen during market turmoil and periods of heightened market volatility. By missing the best days in the market, an investor risks losing out on meaningful return appreciation over the long run.
Not only does timing the market take considerable skill, it also involves temperament and a consistent track record. If there were bullet-proof signals for timing the market, they would be used by everyone.
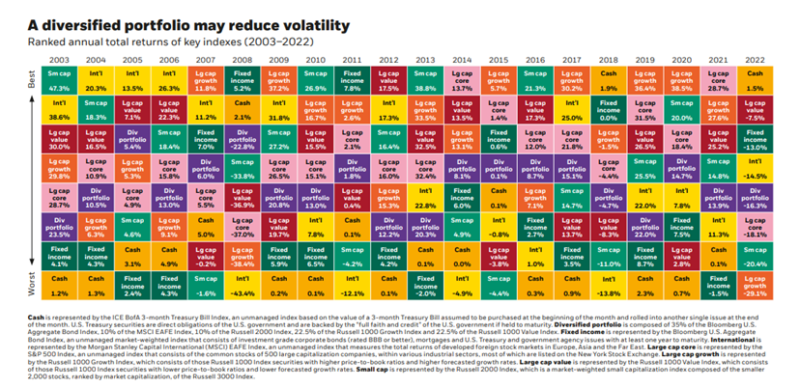
DIVERSIFICATION IS THE RATIONAL WAY TO MANAGE RISK:
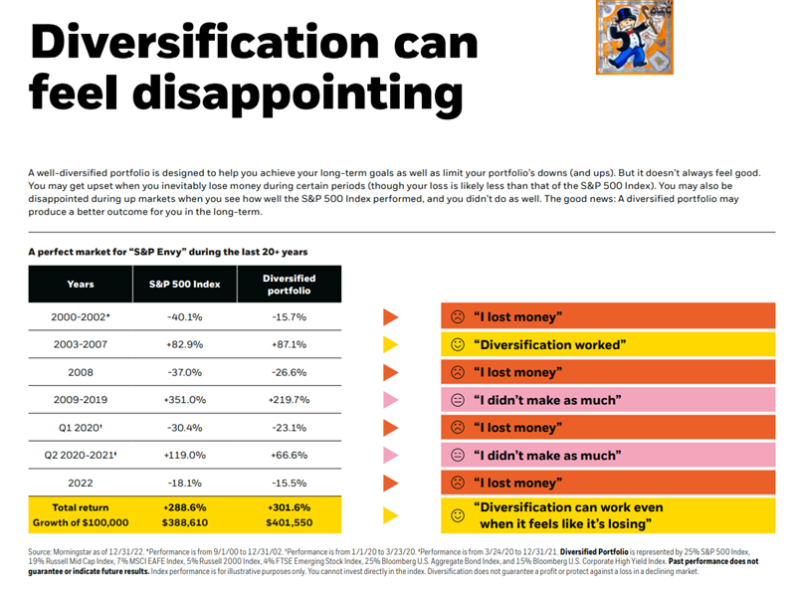
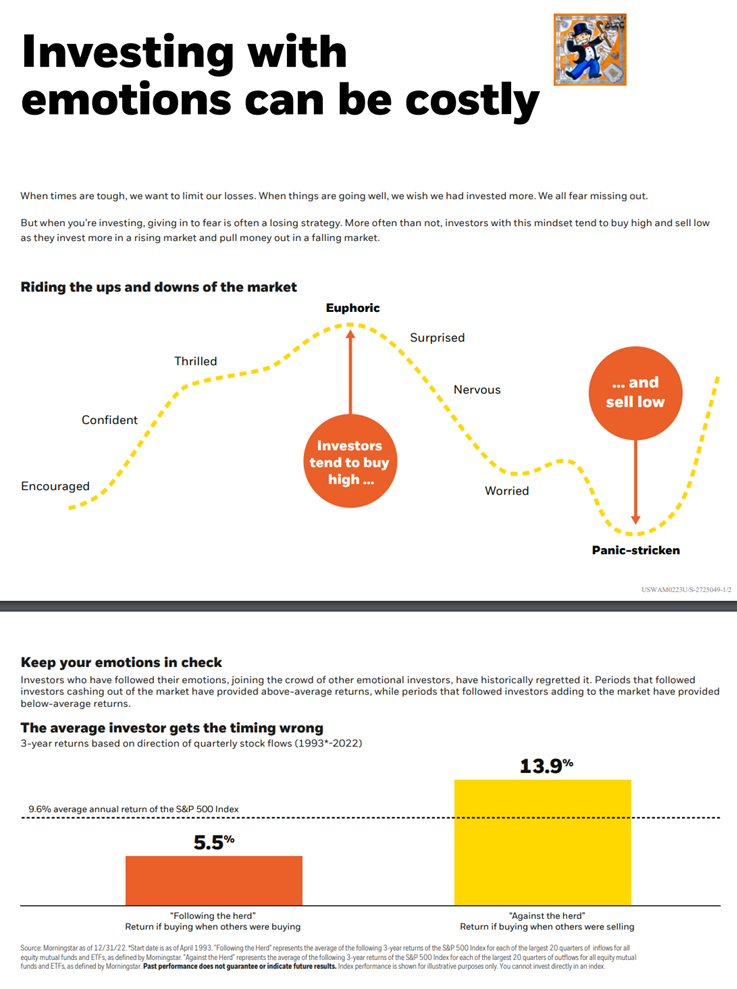
LEARNING TO IGNORE MARKET VOLATILITY:
SUPPRESSING EMOTIONS IS CRITICAL:
“The ideal mindset for an equity investor is equanimity.” – Charlie Munger

OUR FEATURED FUND: WHY WE HAVE RECENTLY BEGUN INCLUDING COWZ IN RVW EQUITY PORTFOLIOS WHERE APPROPRIATE:
WHY CASH COWS?
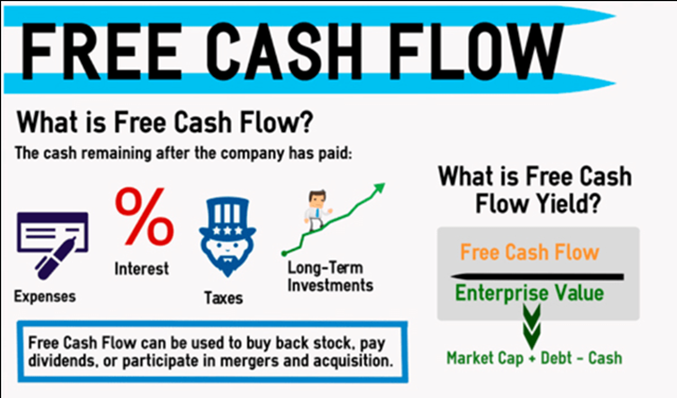
Free cash flow is essentially the money a company has left over after it covers the costs of running its business.Companies with high free cash flow are more in control of their destiny.
Free cash flow is also a good indicator of a company’s long-term sustainability. Companies that generate strong free cash flow are generally better positioned to weather economic downturns. They can also take advantage of new investment opportunities without having to take on debt or issue new shares, which can dilute shareholder value.
Unlike other financial metrics like earnings per share and revenue recognition, which can be subject to accounting manipulations, free cash flow is a more reliable measure of a company’s financial health.
There are many ways to value a company: earnings, cash flow, book value, dividend yield, discounted cash flows, sales, etc. But ultimately, Buffett considered one kind of metric his favorite, and what he called “owner earnings,” free cash flow.
“Free cash flow Is All You Should Care About” – Bill Ackman
Championed by investment mavens like Bill Ackman, this metric serves as a litmus test for business excellence and financial resilience. But why does free cash flow garner so much attention, and why is it hailed as the touchstone of value investing?
See this: https://www.newtraderu.com/2023/08/15/bill-ackman-free-cashflow-is-all-you-should-care-about/
RETURNS FOR COWZ VS. THE TOTAL MARKET OVER THE PAST 2 YEARS
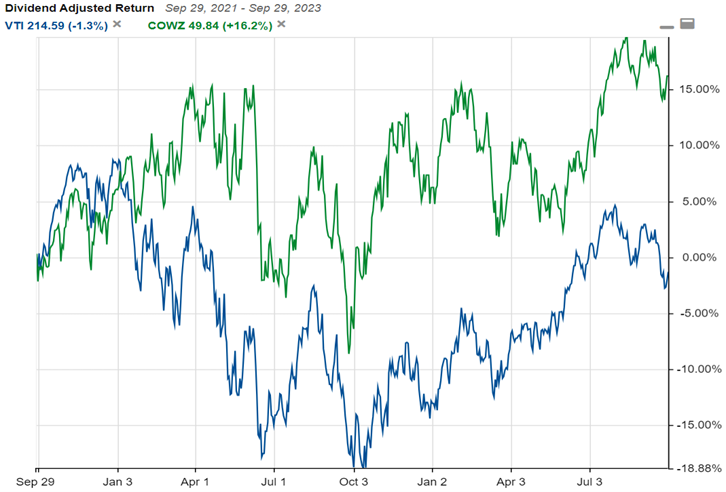
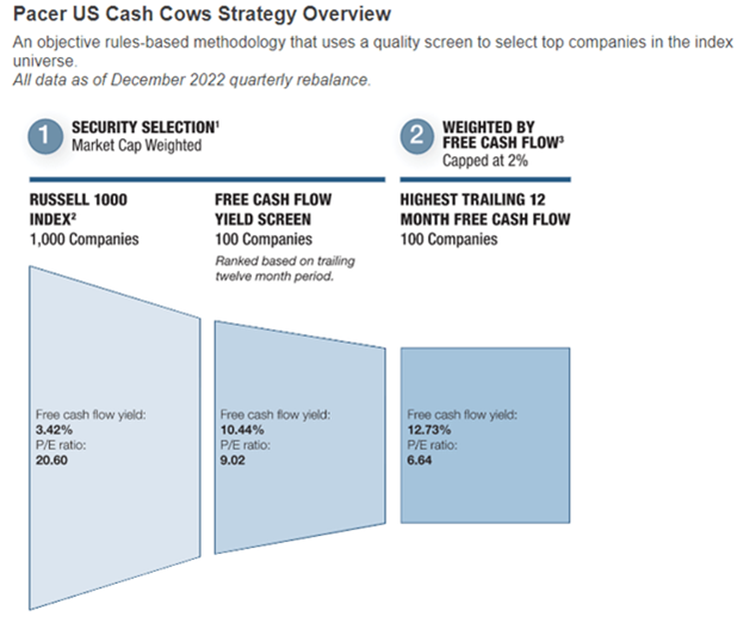
- Pacer US Cash Cows 100 ETF is a value-oriented exchange-traded fund that uses free cash flow/enterprise value, a metric that has been reliable over three decades.
- The COWZ ETF owns 100 select companies that generate the highest ratio of free cash flow. The portfolio is reconstituted quarterly to ensure that the cream rises to the top.

WISDOM FROM CHARLIE MUNGER

FEATURED PODCAST: PROFOUND LESSONS IN THE ART OF BECOMING & STAYING WEALTHY
Morgan Housel is one of the most important financial philosophers we follow. You should too. Listen to this and we’re sure you will become regular listeners.
Listen on Apple Podcasts: https://podcasts.apple.com/us/podcast/the-morgan-housel-podcast/id1675310669?i=1000631128385
Your valuable feedback is important. Please take a moment and give us a review on Google (click here).
Sincerely,
Your RVW Wealth Team:
Selwyn Gerber, Jonathan Gerber, Loren Gesas, Mary Ann Moe, Simon Liu, Lisa Blackledge, Jesse Picunko, Dylan Scott, Teresa Green, Simmons Allen, Morgan Vickers, Kelly Sueoka, Shuey Wyne, Drew Wallis, Joseph Woods, and Kelly Richardson
FOR IMPORTANT CURRENT COMPLIANCE AND DISCLOSURE INFORMATION GO TO https://rvwwealth.com/compliance
NOTE: The information provided above is not complete, may be erroneous, and omits important data. The charts are estimates and may contain inaccuracies or distortions.
Read and rely exclusively on actual offering documents and on statements received directly from your custodian. The information prepared by us is to highlight aspects of your investments but is incomplete. No decision should be made, or action taken based on it. Investments are not guaranteed and may lose value. Past performance is not indicative of likely future returns.