
Summary
- It’s popular to pick your own dividend-paying stocks, but consider the tax effects of rebalancing outside an ETF.
- If you do the same rebalancing in an ETF structure, the “in kind” transfers wipe out those taxes.
- We ran a simulation of WisdomTree’s DGRW ETF to show the HUGE difference this would make over 5, 10, and 20 years.
Overview
Much has been written on the benefits of ETFs over mutual funds and individual stock picking, but here we are going to focus in on a single, often underappreciated aspect–the ability of ETFs to defer capital gains taxes that arise from portfolio rebalancing–and we are also going to model and share the results.
The ETF Advantage
Investors who pick their own stocks and rebalance them accordingly are at a disadvantage to those who follow similar strategies using ETFs. Because of the way ETFs are structured, they can perform their periodic (annual, quarterly, or whatever) rebalancing using “in kind” share exchanges. In these exchanges, the shares of overweight holdings are exchanged for the shares of underweight holdings, restoring the fund to its desired allocation but without triggering a taxable event. Conceptually, this is very similar to the popular “1031 exchanges” real estate investors use to avoid paying taxes as they upgrade from one house to another. And, like the effects of 1031 exchanges, the differences–due to the effects of compounding–can become substantial over time.
DGRW: ETF vs Non-ETF
To illustrate the effects of these rebalancing-triggered taxes, we re-created WisdomTree’s U.S. Quality Dividend Growth Fund (DGRW), assuming the same holdings and rebalancing activities, but outside of an ETF fund structure, for the 4.5-year period from 6/28/2013 to 12/31/2017.
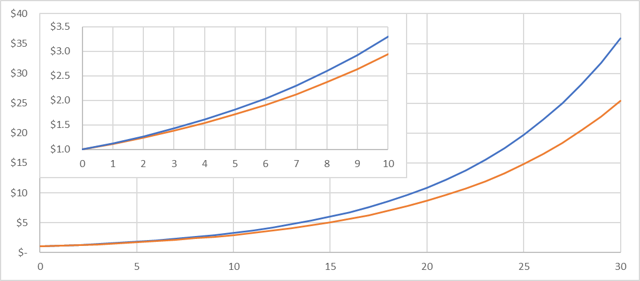
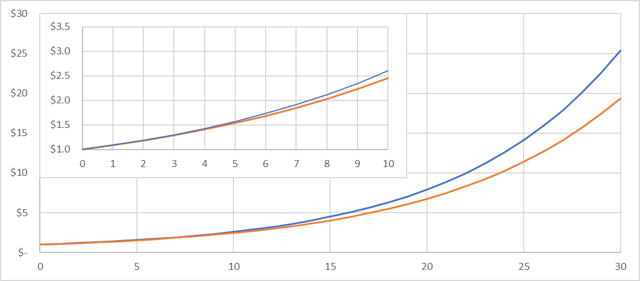
Our results show that the average annual tax deferral would have been equal to 1.3% in annual return. Extending this difference over a 10-year period, a hypothetical dollar invested in the ETF structure would have grow to $3.30 vs. $2.94 in the non-ETF portfolio. That’s a result that’s 12% higher thanks to the ETF structure. After 30 years, the amount would be 41% higher, with a dollar in the DGRW ETF growing to $35.84 compared to $25.40 for a dollar invested in the non-ETF equivalent. These results are shown in Figure 1.
Figure 1: 10-Year and 30-Year Performance of $1 Invested
In Figure 2, we break down the 4.5-year study period into five periods, with the first period being the half year from June 28, 2013 to December 31, 2013, and the remaining periods each covering a full year. Assuming a $10,000 initial investment and a 30% capital gains tax rate (20% federal, 10% state), Figure 2 shows the actual capital gains of the DGRW ETF, the estimated realizedcapital gains triggered by rebalancing, and the cash taxes on those gains needed to be paid at the end of each period.
Figure 2: Total Gains, Realized Gains, and Associated Taxes
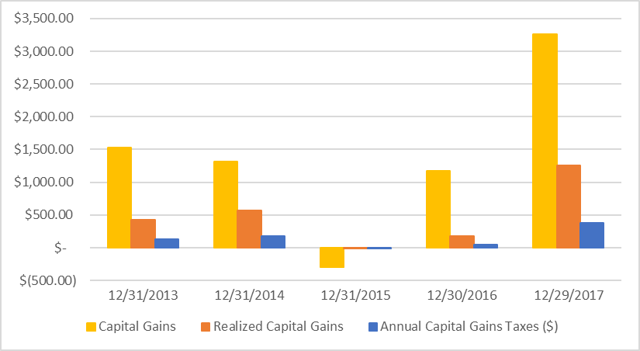
As the figure shows, the cash taxes on realized capital gains vary from one period to the next, driven largely by the total capital gain for that period. In years where the fund did well, the cash taxes were highest. In years where the performance was flat or slightly negative, the cash taxes were virtually nonexistent.
Figure 3 shows the same annual capital gains taxes from Figure 2, but in a way that shows their cumulative sum over time. By the end of the 4.5-year study period, the cumulative amount of cash taxes paid comes to $730.40, or 7.3% of the initial investment amount.
Figure 3: Cumulative Capital Gains Taxes
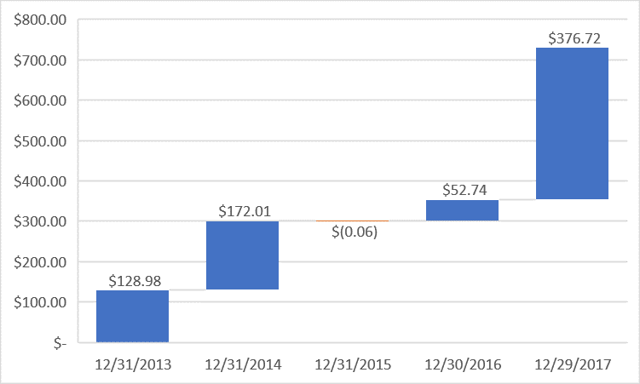
Note, that the cumulative amount of cash taxes paid over the study period—the $730.40 figure—is less than the difference in investment outcomes that would have resulted (See “Accumulated Difference” in Table 1 below). This is due to the effects of compounding. Each year, as the cash taxes would be taken out, the compounding base would have been reduced. The result, once factoring the lower compounding base into each period, is a total accumulated difference in outcomes of $862.76, or 8.6% of the initial investment amount.
Table 1: Accumulated Difference in Investor Outcomes
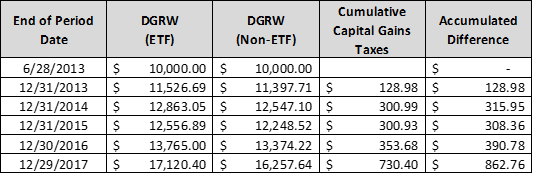
Figure 4 shows how the amounts in the “Accumulated Difference” column would appear as a widening gap between the two scenarios using the actual DGRW performance and the simulated non-ETF portfolio performance over the study period.
Figure 4: Actual DGRW Performance vs. Non-ETF Equivalent
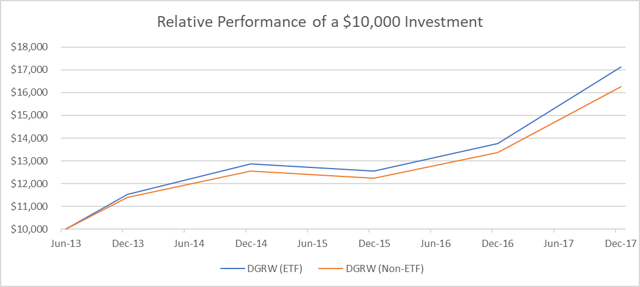
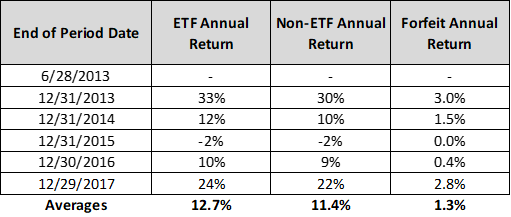
Table 2 shows the returns of the DGRW ETF and the non-ETF equivalent for each period and the forfeited return in each period. Note that, because the first period covered half a year instead of a full year, the calculated 6-month returns were annualized for comparability. The annualized average return for the ETF scenario (the actual DGRW return) was 12.7% per year while the average annualized return for the non-ETF scenario was 11.4% per year.
Table 2: Actual DGRW Returns vs. Non-ETF Equivalent
If the same 1.3% annual forfeited return is projected over 10 and 30 years, assuming the same average annualized return of 12.7% for the DGRW fund, the results would be those shown in Figure 1 (reproduced here as Figure 6 for convenience). As the figure shows, what starts out as an apparently small difference in Figure 4, becomes much more substantial over 10-year and 30-year investment horizons, resulting in ETF vs. non-ETF outcomes that are 12% and 41% higher respectively.
Figure 6: 10-Year and 30-Year Performance of $1 Invested

Liquidation Effect
The last thing to consider is the tax effect of liquidating the entire portfolio at any given moment in time under either of the two scenarios. If these holding are held indefinitely, or until an inheritance event triggers a step-up in the cost basis, then the liquidation tax effect would be irrelevant. However, if for any reason the holdings needed to be sold all at once on some future date, the effect would be to marginally reduce the gap between the ETF and the non-ETF scenarios. This would result from the fact that the ETF scenario’s cost basis would stay fixed while the non-ETF scenario’s cost basis would slowly increase due to the closing out of appreciated holdings at the lower cost basis and reinvesting the larger sums. The effect on the two scenarios is shown in Figure 8.
Figure 8: Performance Adjusted for Liquidation Effect
As the figure shows, the overall returns for both scenarios are reduced and the performance gap is narrowed from what is shown in Figure 6. Over 10 years, a dollar invested in the ETF grows to $2.61, a number that is 6% higher than the $2.46 amount in the Non-ETF scenario. Over 30 years, a dollar invested in the ETF grows to $25.39, an amount that is 31% higher than the $19.38 amount in the Non-ETF scenario. But again, if the ETF is held indefinitely or until an inheritance event, this would be a moot point, because the step-up in cost basis would place the two scenarios right back on the same footing and the results shown in Figure 6 would be the proper basis for comparison.
Conclusion
The small and seemingly inconsequential benefits of deferring capital gains taxes incurred from portfolio rebalancing can have a large impact on investor outcomes over time. This reality can be seen in the difference in estimated outcomes for an investor who invested in the DGRW ETF for the 4.5 years from 6/28/2013 to 12/31/2017 and one who invested in the exact same portfolio outside an ETF structure. The ability of ETFs to help investors defer these taxes makes these instruments an ideal tool for investors who want to take advantage of such approaches to gaining incremental effective returns over the long run.